
How Does Descartes Analytics Work?
Descartes Analytics PowerBI reporting was designed for your executive team to quickly pull key performance indicators, all within one tool! Once you sign up, Descartes Analytics will appear in the dropdown window of your homepage.
How To View Aljex Analytics in Microsoft Power BI
There are 5 tabs of Financial and Volumes data, with specific tables of information:
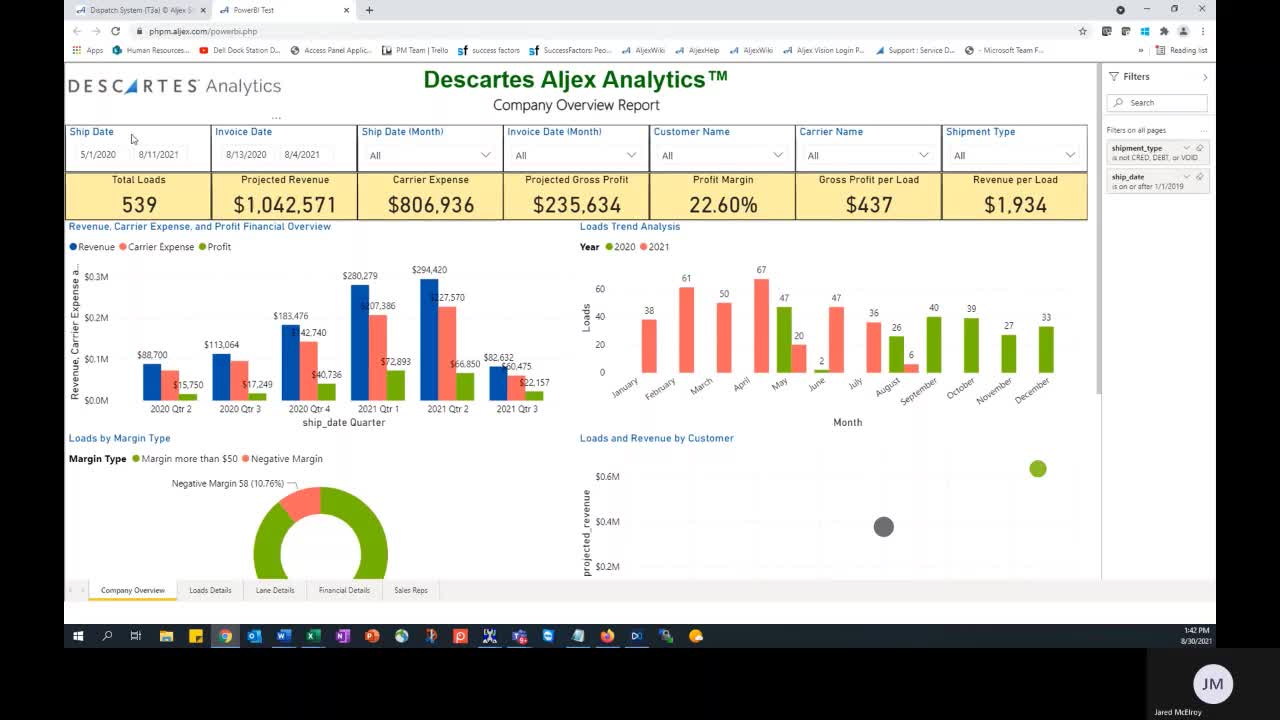
Company Overview – Financial and volume data tables set in bar and line graphs that can be adjusted to view by day, week, month, quarter, or year
Shipment Details – Customer, Carrier, Dispatchers, Office, Sales Rep, Shipment Modes and Types,, Dispatchers and an “All in One” data table
Lane Details – Shipping history data by state to state or city to city with volumes and financials, including by customer and carrier
Financial Details – Projected revenue and expense financials by invoice status with customer, carrier and an “All in One” data table
Sales Rep – Revenue, profit, and margin by Sales Rep with assigned customer and a specific “New Customer” table for customers who have shipped in past 90 days
Data tables can be filtered by simply clicking on a data point and the remaining tables on that tab will be updated based on that filter.
All data is exportable to Excel to make it easier to share with your management team.

How Much Does Descartes Analytics PowerBI Cost?
For pricing information, please get in contact with the Aljex Sales Team: [email protected]